In this article
A scoreboard tells me who finished a game with the most kills. It does a much worse job of explaining why our jungler arrived late to dragon, where our support was before a fight, or which rotation left half the map open.
That is the problem I wanted to work on with Ward. Take a League of Legends replay, extract enough information to rebuild the match on a map, and make that map useful during a review. Scrub to an objective. Follow a player. Draw the alternative rotation. Leave a note at the moment it matters.
The interesting part is what happens between selecting a .rofl file and getting that review workspace. A replay is not a convenient table of champion coordinates. The game exposes some of the information I need, the minimap exposes another part, and neither source arrives on the schedule I would ideally choose.
This article goes through the system I built around those constraints: the Windows extractor, computer vision, timing, calibration, reconstruction, storage, and the web application. I also go through the recorded benchmarks, including the cases where going faster made the output worse.
If you came here looking for ROFL extraction: Ward plays the replay through League, captures the minimap, combines detected positions with local game data, and writes structured records. It does not directly decode every packet inside the ROFL file. That distinction explains most of the architecture.
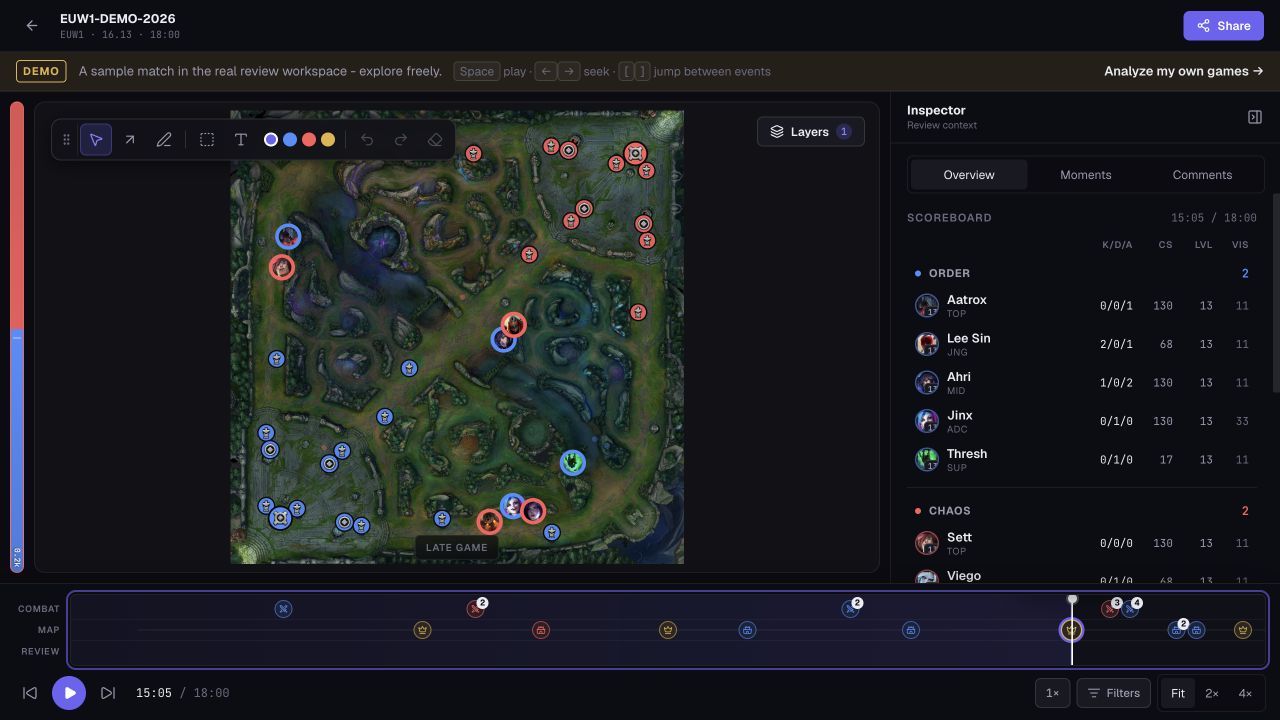
The screenshots show the live public demo, using its sample match. They illustrate the real review interface, not a benchmark replay. Performance figures below come from the repository's recorded experiments; they were not rerun on new hardware for this article.
1. From ROFL replay to something a coach can inspect
My other project, invade.lol, explores match statistics. Ward goes deeper into an individual game. I wanted to keep the sequence of events, not only the result.
Imagine reviewing a lost dragon. A useful interface should let you move backwards from the objective, see which players were nearby, and compare their movement before the fight. A single screenshot is insufficient. So is a kill feed on its own. The value comes from aligning space, time, player state, and annotations.
The product has four main parts:
| Part | Responsibility | Implementation |
|---|---|---|
| Extractor | Play a replay, sample the minimap, produce positions and game state | Python, YOLO11, ONNX Runtime |
| Desktop | Select files, launch extraction, show progress, read and upload results | Electron and Vue |
| API | Import matches, serve frames and events, manage access and review data | AdonisJS and TypeScript |
| Web | Replay the extracted map, inspect events, draw and review | Nuxt and Vue |
PostgreSQL holds application records. ClickHouse holds the frame and event telemetry. These are different workloads with different lifecycles, a distinction that becomes especially important when an import fails halfway through.
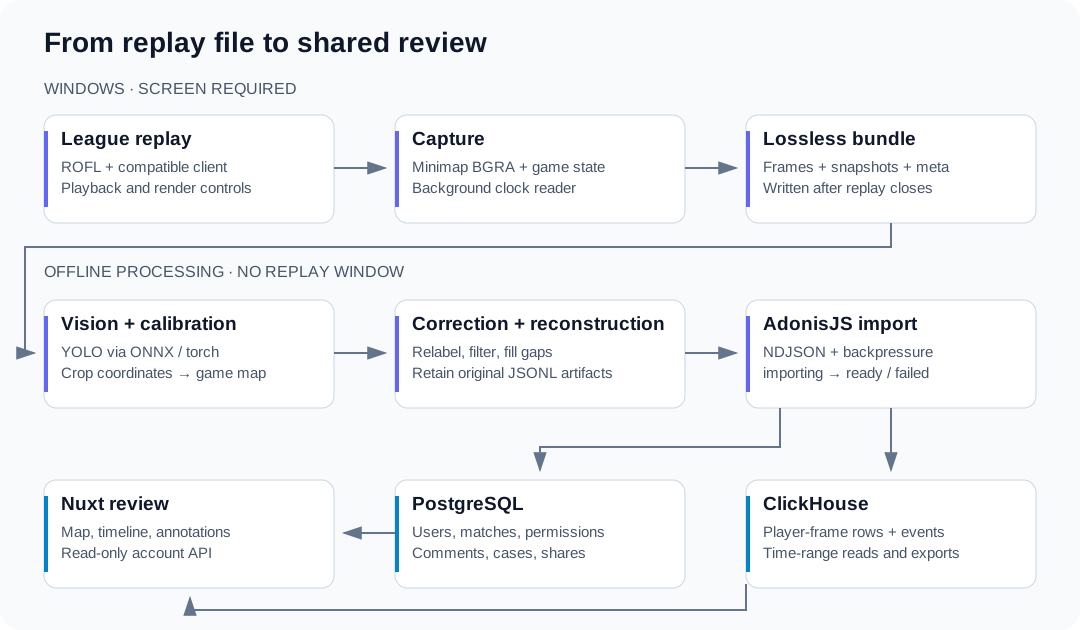
The screen-dependent work ends after capture. Offline inference still has to finish before the extracted match can be uploaded and reviewed.
The boundary I care about is simple: the browser should not need League installed. Windows and the game client are extraction requirements. Reviewing already extracted data is a web application problem.
2. Why ROFL extraction is a data fusion problem
There are three interfaces worth separating. The League Client API helps with replay launch. The local Live Client Data API supplies player state and events. The Replay API controls playback and rendering.
The extractor uses the local game endpoints on 127.0.0.1:2999. The Live Client Data payload supplies things like champion names, teams, levels, scores, death state, and events. The per-player records consumed by Ward do not supply the map coordinates needed for the viewer. I recover those from the minimap.
The Replay API lets the extractor pause, seek, change speed, and configure rendering. It needs to be enabled in the local game configuration. Riot documents the two game interfaces in its Live Client Data and Replay API reference.
The fusion step therefore combines two kinds of evidence:
- Structured state: who is playing, whether a player is dead, their score, and which events have occurred.
- Visual observations: which champion icon appeared at a particular location in the minimap crop.
Neither replaces the other. Computer vision alone cannot reliably tell me the current scoreboard. Player state alone cannot tell me which side of a wall someone occupies.
The same separation matters for the phrase “no Riot API key.” This extraction path does not require a public developer API key, but it absolutely uses local client APIs. Calling the entire implementation “API-free” would hide one of its most useful design decisions.
A replay still needs its environment
The extractor cannot make an incompatible replay playable. The June 27 change reads a short header prefix to recover a version string on recognized ROFL files, then compares the first three version components with the installed client. It ignores the trailing revision and avoids declaring incompatibility when parsing is inconclusive. This is a targeted compatibility preflight, not a full binary replay decoder. The recorded ROFL needs a compatible League client patch. The benchmark report contains a useful example: one replay could be captured live on the installed patch, while another could only be re-analyzed from previously saved bundles.
Likewise, screen capture requires a rendering desktop. An asleep display, collapsed game window, or disconnected remote session can produce black frames. Ward has preflight checks for these conditions because a thousand valid-looking JSON records generated from black images would be a particularly bad failure mode.
The extractor also turns off unnecessary world rendering through the replay controls. The minimap is what matters, so spending GPU time drawing the rest of the scene buys little for extraction. This helps, but it does not remove every visual effect from the minimap itself. That limitation shows up directly in the speed benchmarks.
3. The first bottleneck was the replay, not the neural network
The straightforward extraction loop is easy to describe: pause, seek to a timestamp, wait for the image to settle, capture, infer, repeat.
It is also expensive. The project notes put individual pause-seek operations in the hundreds of milliseconds. At thousands of sample points per game, even an infinitely fast detector would spend a long time waiting for the replay engine.
That is why the extractor has a forward-playing pipeline. Let the replay advance, collect frames on a game-time grid, and run inference while it plays. In the coupled path, a producer submits work to a bounded queue, workers detect champions, and a writer restores chronological order.
That last part is necessary. Worker completion order is not game order. Frame 102 can finish before frame 101. The writer stores results by index and flushes the next contiguous sequence, so concurrency does not silently rearrange the timeline.
The bounded queue is also deliberate. If inference falls behind, allowing memory to grow forever does not solve the underlying throughput problem. The producer counts dropped grid points instead. The resulting metadata makes the failure observable.
A first approximation for coupled playback is:
playback_speed ≈ inference_frames_per_wall_second × sample_step × headroom
With a sample step of half a game second, each wall second at 12× playback needs about 24 images processed. Headroom leaves capacity for capture, scheduling, and uneven inference latency. The code uses a throughput measurement rather than assuming every machine can sustain the same rate.
This improved throughput, but it still tied the amount of time League occupied the screen to the user's inference hardware. That was the next problem to remove.
4. Deferred inference changed the user experience
The useful question became: what must happen while the replay is visible?
Capturing the pixels must happen then. Running the detector does not. Neither does compressing the images, correcting trajectories, or uploading the result.
The deferred path therefore performs a small capture pass, closes the replay, then analyzes the captured material offline. In the current desktop code, this is the default: it launches the extractor with --defer-inference, a 0.5 second sampling step, correction, and reconstruction enabled unless explicitly overridden.
That is an important distinction from the benchmark document's description of the desktop default at the time of its audit. The document identified a change to make; the later implementation includes it.
The capture loop stores raw BGRA minimap bytes in memory with the latest player snapshot and newly observed events. After capture, the bundle writer converts and encodes the frames. A bundle looks like this:
match.bundle/
  bundle.meta.json
  frames.jsonl
  frames/
    000000.webp
    000001.webp
    ...
The image encoding is lossless WebP, with a PNG fallback. Tiny champion icons are exactly where a lossy intermediate format can cause trouble. If I change the pixels while persisting them, a later comparison of model settings no longer uses the same input.
A saved bundle makes experiments much more useful. I can change the confidence threshold, inference size, or model and analyze the same captured pixels again. I do not have to replay the game for every experiment, and a later client patch does not invalidate pixels already captured.
Lossless storage preserves image input. It does not promise identical results across different backends, model revisions, or numerical settings. Those need their own checks.
Moving work out of the loop has a memory cost
The deferred capture implementation accumulates frames in RAM before writing the bundle. That avoids disk and encoding latency during capture, but the memory use grows with match length.
For a 255 × 255 BGRA crop, one raw frame is 255 × 255 × 4 = 260,100 bytes. A 30-minute game sampled twice per second contains approximately 3,600 frames, before drops and endpoint conventions. Raw pixels alone therefore occupy about 893 MiB. A one-hour game is roughly double that, before Python objects and player snapshots.
Those are calculated storage sizes, not measured peak RSS. They explain a real tradeoff: reducing screen time moves pressure to memory and subsequent offline processing. A future bounded spool would have to keep compression and disk work off the capture path while also handling a writer that falls behind.
5. Keeping HTTP out of a millisecond budget
Deferred inference was not enough by itself. A localhost HTTP request can still be too slow when the replay is running quickly.
At 12× playback and a 0.5 second sampling step, the wall-clock budget between samples is about 41.7 ms. At 32×, it is 15.6 ms. A request taking hundreds of milliseconds under rendering load spans many intended samples.
The changelog records exactly this issue: reading playback over HTTP for each grid point caused severe frame loss at high speeds. The fix was to move those reads to a background thread and estimate game time between updates.
The central estimate is:
estimated_game_time = observed_game_time + (
    current_wall_time - observed_wall_time
) * estimated_playback_speed
The reader updates the observation. The producer extrapolates from it. The current code also estimates actual playback speed from consecutive observations and smooths accepted estimates, because requested speed and sustained speed are not always equal.
There is a subtle failure mode here. An extrapolated clock can keep advancing even when the game freezes. Ward checks for stalls against the authoritative reader clock, not merely the extrapolation. Otherwise the extractor could continue recording repeated pictures under increasingly fictional timestamps.
The output keeps both t, the intended grid point, and game_time, the time associated with the observation. For deferred capture, that latter value is based on the clock estimate. Player state is the freshest available background snapshot. These are not an atomic snapshot of the game engine.
That matters when interpreting half-second output. A 0.5 second target grid describes requested density. It does not establish half-second synchronization accuracy, particularly at high speed. API age, extrapolation error, rendering, and capture timing all contribute.
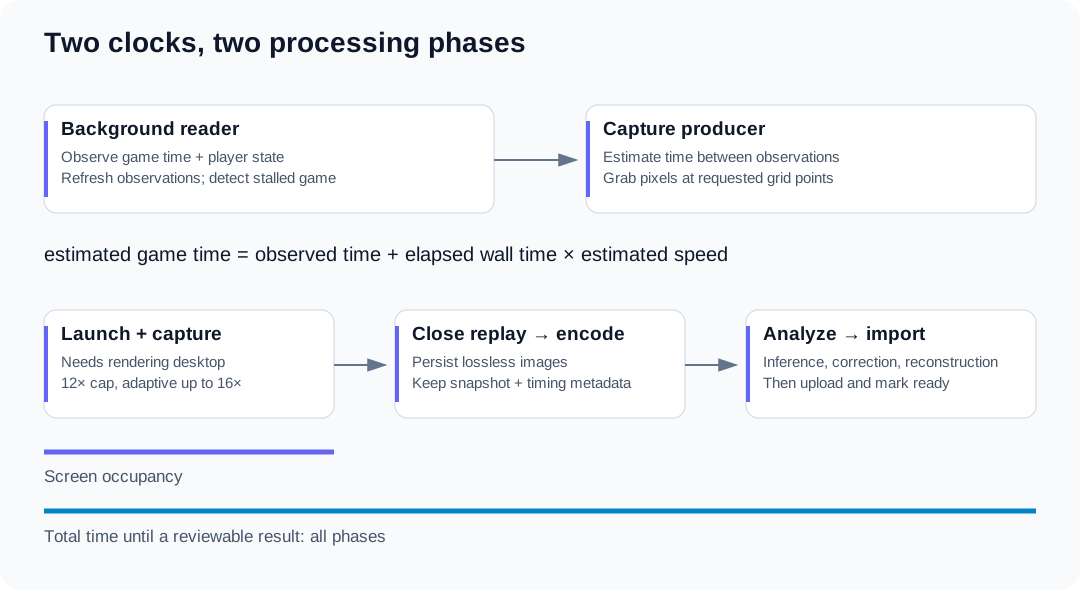
Sampling density, timestamp fidelity, screen time, and final processing time are separate measurements. Optimizing one does not automatically improve the others.
6. Detecting the right champion, not merely an icon
Ward uses a YOLO11 minimap detector. The default model is yolo11l-minimap, and its class names have to be reconciled with the names coming from the game.
I did not train those original weights. They come from boboyes' League of Legends minimap detection model. My work here is the surrounding extraction system, runtime integration, filtering, calibration, correction, and product. The model card identifies a noncommercial license; converting weights to ONNX does not erase that condition.
Use the roster as a constraint
The match already tells me which champions are present. There is little reason to ask the model to freely choose from every class when only a small subset can be correct.
Ward maps the roster to model classes and constrains detection accordingly. This reduces off-roster errors and lets the confidence threshold be tuned within a more relevant candidate set. The v0.2.0 changelog records an improvement in frame coverage after introducing that constraint. I treat it as a recorded experiment, not as a universal improvement for every patch and composition.
Name normalization matters as much as the class filter. A disagreement between a model label and an API name should not turn a valid detection into an unmatched player. A shared name module keeps detection and record assembly consistent.
Larger model input was not automatically better
The crop is about 255 pixels across in the documented calibration. Resizing it to 640 does not create new visual information. It does increase input pixel count by approximately 640² / 256² = 6.25.
The extractor's automatic size selection rounds the longest crop dimension up to the model stride, with a floor and cap. A 255-pixel crop therefore becomes a 256-pixel input. The code comments and changelog also record a live experiment where larger inputs hurt coverage for this model.
There are two different observations here. The pixel-count ratio is arithmetic. The effect on throughput and detection quality must be measured. Convolution cost, backend implementation, and the model's training distribution prevent a simple pixel ratio from being a guaranteed speedup.
Mirror picks need another identity signal
A champion class is not always a unique player. If the same champion appears on both teams, the implementation uses the blue or red icon border to help disambiguate ORDER and CHAOS.
This is a good example of adding a small domain-specific signal rather than asking a generic detector to solve every identity problem. It also has limits: an unreadable border is not evidence for a confident team assignment. The old README's blanket warning about mirror picks is less complete than the later changelog and detection code.
7. Calibration: a plausible dot can still be in the wrong place
The detector gives a box center normalized within the crop. The review system needs game coordinates. A tempting implementation maps crop edges directly onto map bounds and flips the vertical axis.
That produces convincing-looking output, but minimap margins and crop alignment make the assumption unreliable. An incorrect transform can shift every observation consistently. Temporal smoothing will not fix it.
Ward fits an independent linear transform for each axis from known landmarks:
game_x = ax × normalized_x + bx
game_y = ay × normalized_y + by
The vertical coefficient is normally negative because screen coordinates grow downwards. Game coordinates use the opposite vertical direction for this map.
Two distinct points on each axis determine a line. More landmarks allow a least-squares fit, and landmarks should be spread across the map. Points clustered in a small area make extrapolation fragile. The implementation rejects degenerate fits where an axis does not vary sufficiently.
As an illustrative calculation, take normalized coordinates (0.08, 0.92) and (0.92, 0.08), paired with game coordinates (1400, 1400) and (13500, 13500). The fitted horizontal scale is approximately 14,404.76 game units per normalized unit. The vertical scale has the same magnitude and opposite sign. These are example calibration points, not a claim that every setup uses those exact coefficients.
The inverse transform is just as useful. Ward back-projects landmarks into the minimap overlay, so I can check whether the calibration puts a known point where it belongs. This tests something different from whether the detector placed a dot on the center of an icon.
The metadata carries a calibrated flag. Absolute-landmark reconstruction is gated on a calibrated Summoner's Rift run. Relative calculations can still use observed positions, but I should not attach precise fountain or objective coordinates to an unknown transform.
8. Correction and reconstruction solve different problems
Raw output has gaps. Icons overlap during fights, visual effects obscure them, and classifiers occasionally assign the wrong identity. The response should not be to silently make every row look complete.
Ward keeps separate raw, corrected, and reconstructed artifacts. That gives the pipeline somewhere to record both improvements and assumptions.
Correction works from observations
The correction pass includes temporal relabeling, outlier rejection, interpolation, and event deduplication.
Temporal relabeling builds tracks over the time-ordered output and uses champion votes to repair short mislabels. This happens after extraction because independent inference workers are not a single continuous tracker. A post-processing pass can see the chronological context that an individual worker does not have.
The outlier filter is Hampel-style: it compares a point with neighboring positions and rejects sufficiently large deviations. It is a pragmatic spatial filter, not a complete movement simulator. The distinction matters around dashes, teleports, and recalls.
Interpolation needs two anchors. If a champion was observed at A and later at B, the corrector can fill a short gap when the death-state and movement constraints permit it:
alpha = (t - tA) / (tB - tA)
position(t) = A + alpha × (B - A)
A line segment is an estimate of the missing path. It does not prove that the player walked in a straight line or crossed traversable terrain. The code's maximum speed and gap limits are filters for plausibility, not knowledge of every movement ability.
Reconstruction uses additional context
A gap with no second visual anchor cannot be filled by ordinary interpolation. Reconstruction brings in events and state: kill participants, objective locations, recent positions, respawns, and death state.
For example, a detected participant near a kill can provide a spatial anchor for an unseen participant. An objective event can provide a pit anchor when the map is calibrated. A recent observation can support a short hold or bounded movement estimate.
These are useful heuristics, but a kill does not logically put all participants at exactly the same coordinate. Ranged abilities, long-distance damage, and assists are obvious counterexamples. The reconstruction code therefore carries source, confidence, and uncertainty information. Its uncertainty radii are heuristic values, not statistically calibrated confidence intervals.
Dead players may be represented at their team's fountain. That is a visualization convention for an inactive player, not a measurement of a corpse location. It can increase “non-null position” coverage without adding a new observation of movement.
Why the later hold is bidirectional
The July 1 diff replaces a simple last-position hold with a bidirectional estimate. Offline analysis can use an observation just after a gap as well as one just before it. Each missing, alive point considers anchors from both directions and selects the nearer one.
Where two nearby anchors imply plausible walking velocity, the estimate projects along that vector. The implementation rejects stale pairs beyond four seconds, speeds above 700 game units per second, and bounds the projected displacement to 1,500 units. These are current heuristic limits, not measured movement guarantees.
The confidence still decreases with time from the anchor, while uncertainty grows. Crucially, inferred hold points do not become new anchors for an endless chain of extrapolation, and a death resets the walk. Without that rule, a guess could repeatedly justify the next guess and drift across the map with apparent continuity.
The same revision adds respawn anchors: a sufficiently recent dead-to-alive transition can seed a fountain position on a calibrated map. Again, the narrow transition window matters. “Alive now” by itself does not mean “still at the fountain.”
The important invariant is that reconstruction fills missing positions rather than overwriting existing detections. A consumer can then choose whether to include event_assist, hold, dead, or other inferred sources in an analysis.
Provenance has to survive the whole pipeline
The extractor is more expressive than a simple boolean saying “position exists.” However, the current ingestion mapping also illustrates how easily that detail can be lost: it branches on detection.inferred, while the corrector's interpolated and relabeled records carry a source without that flag. Those records can consequently be normalized as cv by ingestion. The ClickHouse positional schema also does not retain the reconstruction uncertainty radius.
For the benchmark discussion below, I use the extractor artifacts and the report's source breakdown, not a claim that the cloud cv count is pure raw detection. If I were building a strict downstream accuracy study, preserving those distinctions end to end would be a prerequisite. This is exactly why I keep the original extraction files.
9. Replay extraction benchmarks: the speed ceiling is visual
The most useful experiment in the repository is BENCHMARK_ONSCREEN_TIME.md, dated July 1, 2026. It compares deferred capture at 8×, 12×, 16×, and 32×.
The live sweep used a 926-second game, client patch 16.13.791.5903, a 0.5-second sample step, and conf=0.25. Offline inference used an RTX 3070, Python 3.11.9, torch 2.7.0+cu126, and CUDA half precision. The model input was crop-matched at approximately 256 pixels, with roster-constrained classes.
That environment matters. These are not measurements of the shipped DirectML backend on every user's machine. They are recorded results for a specific capture and analysis setup. The report does not provide repeated-trial distributions or latency percentiles, so I do not attach invented error bars.
Time and sampling loss
| Playback | On screen | Launch to close | Captured frames | Dropped grid points |
|---|---|---|---|---|
| 8× | 127.0 s | 136.3 s | 1,772 | 93 (5.0%) |
| 12× | 87.5 s | 96.3 s | 1,739 | 126 (6.8%) |
| 16× | 68.2 s | 78.9 s | 1,666 | 199 (10.7%) |
| 32× | 36.1 s | 45.1 s | 1,491 | 374 (20.1%) |
Source: the repository's July 1 capture report, whole-game KR replay. “Launch to close” ends when the replay closes; offline inference and upload are excluded. Frame and drop counts are reported as recorded, not recalculated from the rounded 926-second duration.
12× reduced on-screen time by about 31% relative to 8× in this sweep. It did not halve it. At 32× the replay disappeared much sooner, but approximately one in five scheduled points was dropped.
Coverage of captured player-frames
| Playback | Raw CV coverage | Reconstructed coverage |
|---|---|---|
| 8× | 81.5% | 98.3% |
| 12× | 81.5% | 98.1% |
| 16× | 77.7% | 96.2% |
| 32× | 60.0% | 85.9% |
The report defines coverage as player-frames with a non-null position divided by captured frames times ten. It does not measure the distance between predicted and true coordinates. It also does not include dropped frames in that denominator.
That makes it useful, but insufficient on its own. A system can improve conditional coverage by retaining only easy frames. For a complete evaluation I want sampling loss, coverage, and spatial error together.
As a derived illustration, multiply the retained-grid fraction by reconstructed coverage: the 12× run represents approximately 91.5% of scheduled player-grid points, while 32× represents approximately 68.7%. This calculation assumes ten players at each grid point and uses the report's rounded coverage percentages. It is an availability estimate, not accuracy.
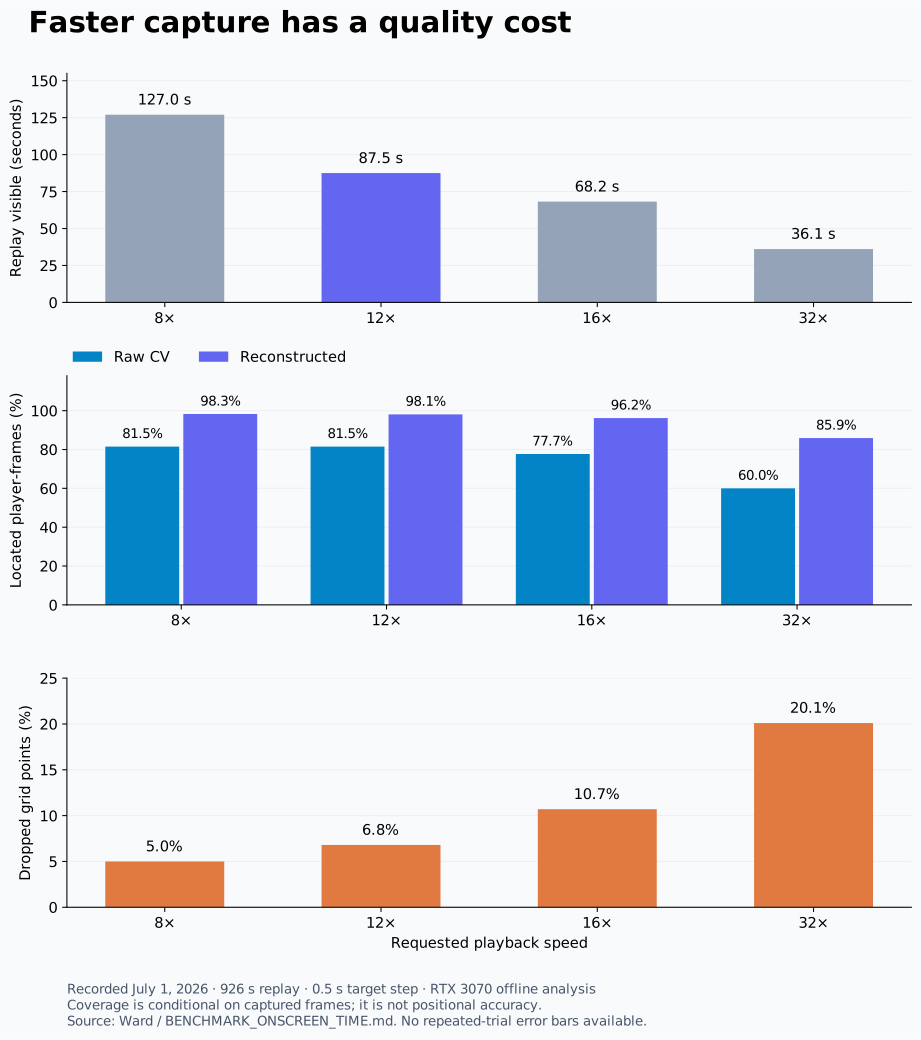
Download the recorded measurements as CSV. Charts reproduce recorded measurements. Coverage is conditional on captured frames. A higher reconstructed percentage means fewer null positions, not independently verified coordinates.
A difficult window tells a different story
The report also evaluates the fixed 540–660 s window. This avoids judging the system entirely from quiet early-game frames and clean fountain positions.
| Playback | Raw coverage | Corrected | Reconstructed |
|---|---|---|---|
| 8× | 82.7% | 93.6% | 100.0% |
| 12× | 84.8% | 93.2% | 100.0% |
| 16× | 78.0% | 89.1% | 96.5% |
| 32× | 45.2% | 59.0% | 75.4% |
At high speeds, action-driven rings accumulate on the minimap and obscure icons. The project notes describe trying render flags without finding one that removes this effect. The engine can advance the game clock faster than it can produce equally useful images for the detector.
This is the distinction that changed the default: the fastest playable replay is not necessarily the fastest usable extraction.
The source composition changes too. Among located player-frames, the report lists direct detections at approximately 75% for 8× and 62% for 32×; weak holds increase from approximately 0% to 5%. Those percentages use another denominator, the located subset. They should not be confused with the raw coverage column above.
What the defaults actually do
The current implementation uses a deferred capture cap of 12×, with a length-adaptive increase toward a 16× hard ceiling. The automatic choice also considers measured capture throughput. An explicit speed override is a separate choice.
The target is to keep replay occupancy manageable without entering the steep quality decline observed at 32×. It is not a universal five-minute guarantee. Very long games, slow loading, poor rendering, and unusual machines can exceed the target.
The report contains additional offline re-analysis of an older EUW replay. It is helpful corroboration, but two replay cases are not evidence for all compositions, patches, resolutions, or hardware. I would need a wider corpus with repeated captures to make that claim.
10. ONNX Runtime: distribution was part of performance
Getting the model to run on my development machine was only part of the job. Shipping a usable Windows application meant thinking about the runtime users would have to download.
The earlier CUDA and torch bundle was around 2.5 GB according to the release notes. The project moved inference to ONNX Runtime and reduced the runtime bundle to a few hundred megabytes. Those are historical packaging figures, not an exact size for every current release.
The runtime prefers available providers in the order CUDA, DirectML, then CPU. The universal Windows build uses DirectML so inference is not restricted to a CUDA installation. The original model-export toolchain remains a build-time concern.
The ONNX adapter exposes the small interface the detector already consumes: prediction results with boxes, classes, confidence, normalized coordinates, and class names. That keeps backend-specific branching out of record assembly.
Preprocessing and decoding still matter. The adapter implements letterboxing, tensor normalization, output decoding, and non-maximum suppression. A numerically valid ONNX export is not enough if the preprocessing silently moves the icon or the decoding interprets the wrong axis.
The parity tests separate raw-graph fidelity from end-to-end decode behavior. They compare identical input tensors for the graph check and use a controlled image size for the decode check. These tests require actual models and the relevant runtimes; the lightweight suite skips them when those dependencies are absent.
There was also a concurrency trap. DirectML does not support multiple simultaneous Run calls on the same session, as described in the ONNX Runtime DirectML documentation. The changelog records crashes with multiple workers and the move to a single ONNX inference session. A worker count that helps a CPU path can be the wrong choice for a GPU provider.
The v0.2.0 changelog records roughly 16 ms per DirectML inference versus 59 ms on CPU in an RTX 3070 environment. The repository’s provider benchmark uses a seeded synthetic 256 × 256 crop, three warm-up calls, and 200 timed iterations by default. It checks the provider that actually bound, so a silent CPU fallback is not reported as a DirectML result. This is a runtime microbenchmark; synthetic pixels do not measure champion-detection quality. I keep that separate from the July capture sweep: a model inference benchmark does not include replay launch, capture, bundle encoding, correction, or upload. It cannot be used as a complete “seconds per replay” number.
11. Streaming the result into two databases
A half-second sample interval produces about 36,000 player rows for a 30-minute, ten-player match before drops. That is a calculated row count, not a claim about production traffic. It is enough to make data shape and streaming worth thinking about early.
The import wire format is newline-delimited JSON. The first line is a metadata envelope. Subsequent lines are frame records:
{"meta":{"extractor_version":"0.2.0","map":{"number":11},"calibrated":true}}
{"t":540.0,"game_time":540.2,"players":[{"champion":"Ahri","team":"ORDER","isDead":false,"map_position":{"x":5400,"y":8100},"detection":{"conf":0.91}}],"events":[]}
Illustrative payload with one player shown. An ordinary ten-player match carries all ten stable player slots in every frame, including players whose map_position is null. The values above explain the wire format; they are not an extracted benchmark observation.
The API reads the body line by line and fans it into position and event streams. Backpressure matters: if a destination cannot accept another row, the producer waits for drain. The helper also listens for close and error, so an insert failure does not leave the request waiting forever for a drain that will never happen.
Validation includes supported extractor version, a stable player count, valid team labels, game times, and a frame limit. Numeric conversion is bounded for the storage types. This is ingestion hygiene, not proof that every submitted coordinate is truthful.
PostgreSQL owns application state
Users, matches, access records, comments, review cases, and sharing belong to the application layer. They have relationships and authorization rules that are naturally expressed in PostgreSQL through the AdonisJS models.
ClickHouse owns positional telemetry
The positional table uses MergeTree, with ordering by (match_id, game_time, participant). That layout follows the viewer's main access pattern: a match, a time range, and the players present in it.
Missing observations are retained with located = 0. Coordinates for an unlocated row must not be interpreted as a real position. Keeping those rows makes the denominator visible, instead of letting missing detections disappear from storage entirely.
The current partition key is match_id. It makes match replacement and deletion convenient through partition removal. It is also a scaling tradeoff. High-cardinality partitioning creates many partitions; it is not a universal recommendation for a large shared telemetry store. ClickHouse's partition-key guidance is useful context for that decision.
I would revisit the partition strategy based on actual match volume, part counts, retention, and deletion requirements. A convenient per-match lifecycle and large-scale merge efficiency are different concerns.
There is no distributed transaction hiding here
The two databases do not share a transaction. The import service uses match states: importing, ready, and failed. It marks the match ready after the telemetry inserts finish; on an error it records failure and attempts to clean up partial telemetry.
That is a practical recovery protocol, not atomicity across databases. Re-import removes the old telemetry before inserting the replacement. If replacement fails, the previous ready dataset is not automatically retained. Concurrent replacement also deserves explicit serialization if the product needs that guarantee.
These are the details I want to make visible in an architecture explanation. “PostgreSQL plus ClickHouse” sounds neat in a stack list. Coordinating their failure behavior is where the real design work starts.
12. A timeline needs stable events
Events look simpler than positions until the same event appears repeatedly, or two different events have incomplete identifiers.
The extractor deduplicates repeated observations. The corrector uses event content because a seek can re-emit the same logical event with a changed identifier. Building names matter here: two tower destructions near the same time must not collapse into one event merely because both lack an ordinary player-victim field.
The ingest service has a related fallback. It uses numeric event IDs when available and a content key for events without them, issuing synthetic IDs for storage. Event type, rounded time, names, and structure fields help distinguish occurrences.
There is no single perfect identity rule for every source behavior. The practical lesson is to model the source's actual omissions and replay behavior rather than assuming every record has a globally trustworthy ID.
The browser then uses those events to build timeline markers and update map structures. A tower destruction is not merely a line in a log; it changes what the map should display after that time.
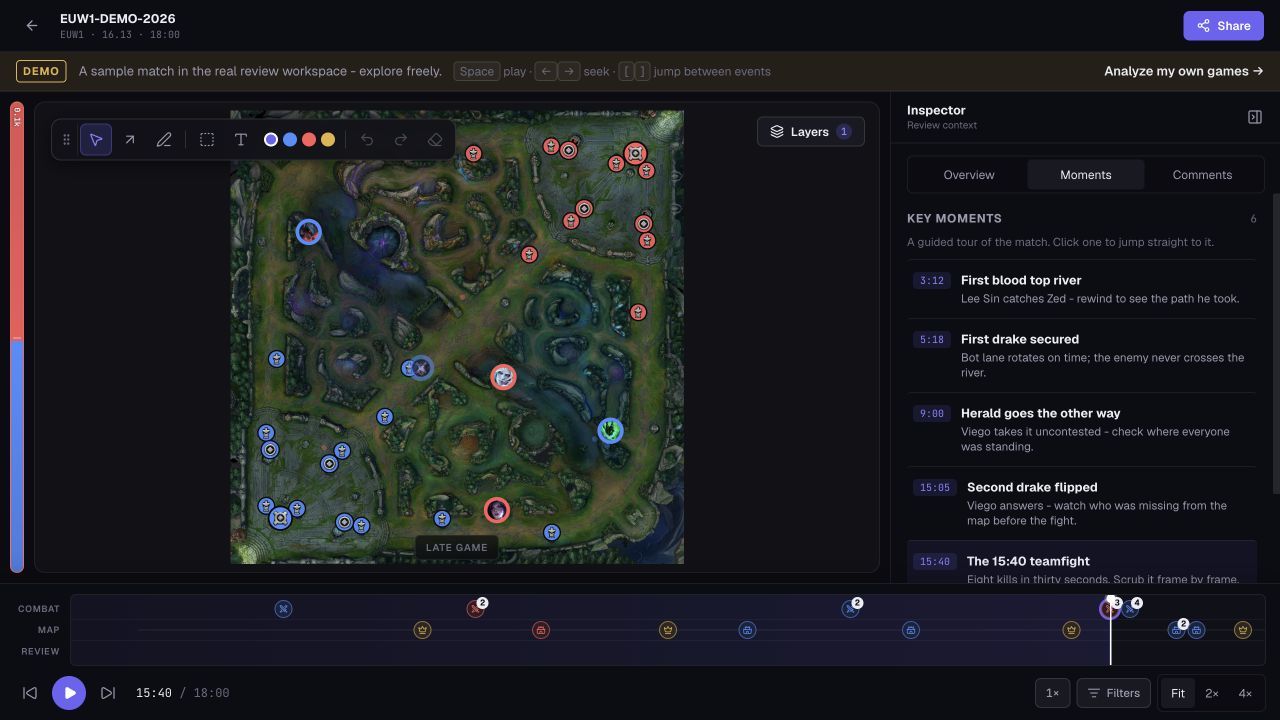
Public demo at the 15:40 moment. The guided moments are sample content; the surrounding viewer is the actual review workspace.
13. The viewer has one clock, but several resolutions
In Nuxt, the replay composable drives playback from one currentTime, advanced with requestAnimationFrame. Map tokens, scoreboard values, event markers, and review context derive from that time.
Sharing one clock prevents a familiar category of UI bugs: the map says one moment, the scoreboard another, and the annotation points at a third. Seeking becomes a state change with consistent consumers.
The data source is abstracted behind the same interface for an authenticated match or a shared match. The demo supplies a sample bundle through the same review machinery. That is why a public demo is useful: it exercises the actual workspace without requiring someone to upload a replay first.
There is another important resolution distinction. The current web composable requests frames with a five-second step and interpolates for playback. The extractor's half-second sampling target is not the same thing as the default browser request density. A smooth moving icon does not prove that a position was measured at every rendered animation frame.
For broad rotations, interpolation can make the map readable while reducing payload. For a precise movement investigation, I would inspect the denser source data and its missing points rather than treating screen animation as ground truth.
The API also supports field selection, downsampled windows, and paged iteration over complete frames. Paging by frames rather than arbitrary player rows matters: splitting a timestamp's players between pages complicates reconstruction for every consumer.
Drawings belong to review context
The map includes arrows, freehand strokes, rectangles, and text. Those drawings make it possible to express an alternative route or mark a region, not just point at a moving icon.
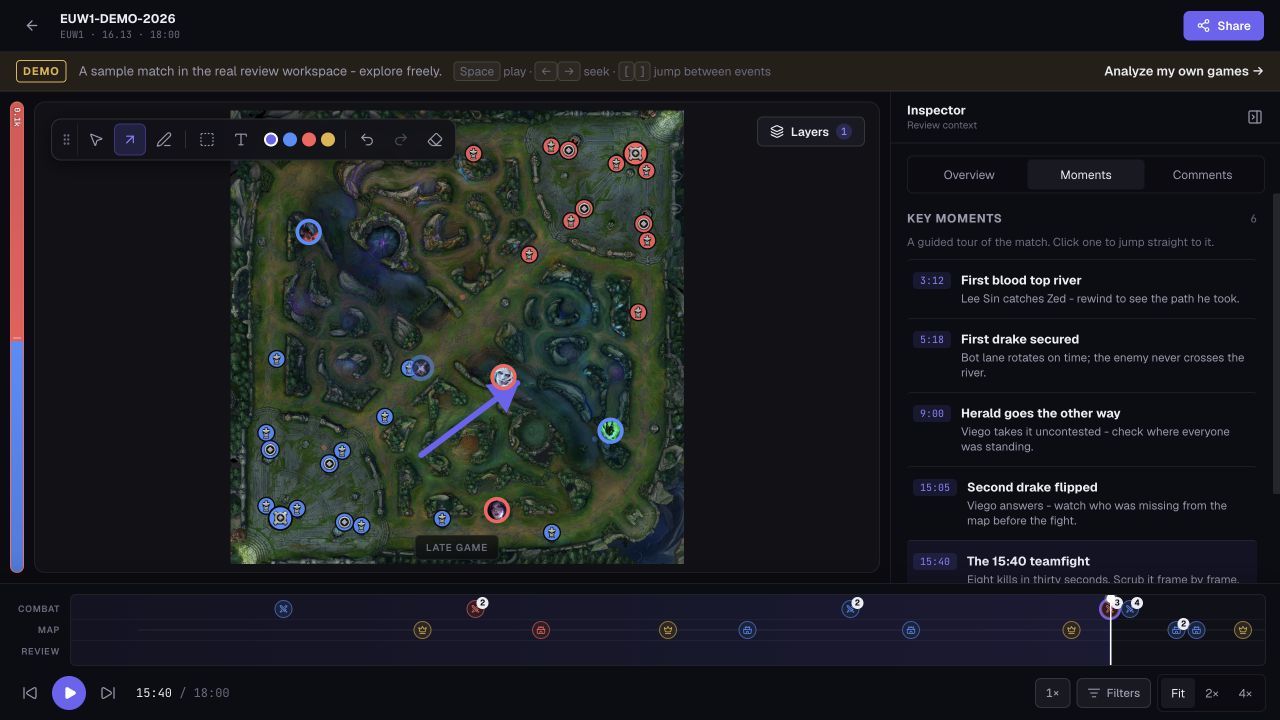
The purple arrow was drawn in the live demo for this article. It illustrates telestration, not an automatically detected player trajectory or a coaching verdict.
A small July 14 fix captures the kind of interaction detail that does not appear in architecture diagrams. Player tokens sat above the SVG drawing surface and stopped pointer events. Drawing worked on empty map areas but could appear broken directly over a champion. The fix dispatches token pointer-down events to the annotation handler when a drawing tool is active, while keeping ordinary player selection for the select tool. Text creation also prevents the original pointer event from stealing focus from the newly mounted input.
The persistence layer includes timestamped comments, cases, and sharing controls. A review artifact needs more than coordinates: which match it belongs to, when it applies, who can see it, and whether a recipient can edit it. Those application concerns are why the relational side of the system remains important.
14. Desktop integration and a read-only match API
The Electron main process launches the extractor as a child process and parses newline-delimited progress events. It buffers partial stdout chunks, because a process stream does not promise one complete JSON message per callback. Progress is then forwarded to the renderer.
The July 1 desktop performance diff replaces readFileSync with asynchronous reads and a line-by-line replay parser. That avoids materializing a whole large file as a string before parsing it and reduces a source of main-process stalls. It still collects parsed records into an array and sorts them, so I would not describe the replay loader as bounded-memory end-to-end streaming.
A synchronous “starting” reservation prevents two near-simultaneous start requests from slipping through before the child process exists. That is a small piece of code with a large effect on usability: accidentally launching two replay extractors is much worse than disabling a button for a moment.
The desktop login flow uses a browser handoff and a one-time code. The API stores a hash of that code and gives it a five-minute lifetime before exchange. This is a dedicated account flow; it should not be confused with requiring a Riot developer key for extraction.
Ward also has a separate read-only API for imported match summaries and review data. Its documented public base is https://ward.invade.lol/api, on the web domain. The Nuxt server validates a personal key and proxies authorized reads to the internal API.
For example, from a terminal with your own key in an environment variable:
curl --fail --silent --show-error \
  -H "Authorization: Bearer $INVADE_API_KEY" \
  "https://ward.invade.lol/api/match/list?status=ready&per_page=20"
The key is shown once at creation and stored as a hash. Reads are scoped to the owning account. The documented rate limit is 120 requests per minute per key, with per-instance in-memory counters. That last detail matters in a horizontally scaled deployment: per-instance limits are not a single global budget.
The public key endpoints intentionally exclude the full per-frame positional dataset. Authenticated frame and export routes serve that different use case. An endpoint that returns every position, every event, every comment, and every annotation by default becomes expensive for consumers that only wanted a match list.
15. How I would reproduce and extend the measurements
I keep three categories separate: recorded live capture results, offline re-analysis, and tests with controlled substitutes. They answer different questions.
To repeat the capture comparison, I would hold the replay, patch, resolution, HUD scale, crop, sample step, confidence threshold, weights, and inference settings fixed. Then capture at each playback speed into its own output directory.
A source checkout exposes the relevant commands:
python -m extractor "C:\replays\match.rofl" `
  --out .\out\capture-12x --launch --capture-only `
  --capture-mode play --speed 12 --step 0.5
For an integrated run that performs analysis after capture:
python -m extractor "C:\replays\match.rofl" `
  --out .\out\complete-12x --launch --defer-inference `
  --speed 12 --step 0.5 --correct --infer
Repeat the capture configuration at 8×, 16×, and 32×, using a compatible replay and a correctly calibrated screen. Keep the resulting metadata and bundles. If changing the analysis settings, rerun against those same bundles to avoid accidentally comparing two different sets of images.
For each run I would record screen occupancy, total time until the final result, captured and dropped samples, coverage at every processing stage, source composition, and peak memory. I would include multiple runs instead of selecting the fastest one.
The fixed mid-game window is worth retaining, but I would add fights, recalls, overlapping champions, and both teams' fountain states. A manually annotated holdout set would let me measure actual position error and identity mistakes. Coverage alone cannot answer those questions.
There is also a denominator check worth automating. A per-record script should count player slots, non-null positions, and each source; separately, the capture metadata supplies grid losses. Mixing these metrics into one percentage makes regressions harder to diagnose.
What I would measure against a holdout
For the next evaluation, I would keep an independently annotated set of replay moments outside the material used to tune thresholds. I would choose those moments before running a new configuration, including difficult cases instead of dropping them after seeing the predictions. Reusing the same capture bundles would isolate analysis changes; repeating live capture would be a separate experiment on sampling and rendering.
The unit of comparison would be a player at a particular game time. A nearby dot belonging to the wrong champion is still an identity error. I would match the player identity first, align the timestamps within a declared tolerance, and only then measure coordinate error. Allowing an evaluator to select whichever neighboring time gives the smallest distance would hide synchronization problems.
For positions in the same calibrated coordinate system, the basic distance is:
position_error = sqrt((predicted_x - reference_x)^2
                    + (predicted_y - reference_y)^2)
I would report the median and a tail percentile, together with the number of eligible observations. An average alone can hide occasional large jumps, exactly the errors that make a rotation look impossible. The reference annotations would need their own uncertainty note: a human selecting the center of an overlapping minimap icon does not produce perfect game-world ground truth.
There are at least four separate results to retain:
| Question | Measurement I would keep |
|---|---|
| Did capture retain the scheduled moment? | Captured versus scheduled grid points |
| Did the pipeline return a position? | Located versus expected player slots, with the denominator stated |
| Is the position attached to the right player? | Identity errors among independently labeled cases |
| How far is the position from the reference? | Spatial-error distribution for matched identities and times |
I would break those results down by raw, corrected, and reconstructed output. Comparing only the error of available raw points with the error of all reconstructed points changes the population: reconstruction deliberately adds harder cases. A paired comparison on shared observations, plus a separate report for newly filled gaps, makes that difference visible.
For example, imagine two settings that both locate 95 out of 100 labeled player-moments. One swaps identities during a fight; the other leaves five missing points but preserves every observed identity. Their coverage is identical, but they support very different conclusions about who rotated where. This is a hypothetical example, not another Ward benchmark.
Diagnose the stage before changing the threshold
When a review looks wrong, I would work backwards from the affected moment through the viewer, imported records, reconstructed output, raw detections, and saved crop. Each boundary offers a different explanation:
| Symptom | First comparison I would make |
|---|---|
| A whole moment is absent | Check scheduled versus captured timestamps before investigating detection confidence. |
| A player disappears in a crowded fight | Inspect the saved crop and raw boxes before changing reconstruction rules. |
| A champion changes identity | Inspect roster constraints, team assignment, and the correction history. |
| Most players shift in the same direction | Check crop bounds and calibration before retraining a detector. |
| Positions seem consistently early or late | Compare capture time and associated game snapshots before blaming coordinates. |
| A path becomes suspiciously smooth | Check inferred sources and the viewer's five-second sampling separately. |
| Local output and cloud statistics disagree | Compare ingestion provenance mapping and missing-position flags. |
These are diagnostic starting points, not unique causes. Their value is in narrowing the next experiment. Raising confidence cannot repair a missing capture, and adding interpolation cannot correct a coordinate transform that shifts every observation. Keeping the intermediate artifacts lets me investigate the layer that actually introduced the error.
What the automated tests establish
The offline tests cover the transform, record assembly, chronological writing, drop behavior, correction, reconstruction, bundles, and error paths through substituted replay, capture, and model interfaces. They can verify that the pipeline responds correctly to controlled inputs. They cannot certify a new League patch, real screen capture fidelity, or GPU performance.
That separation is useful rather than disappointing. Fast deterministic tests protect the logic; live experiments validate the external system the logic depends on.
16. What this project taught me
The largest gains came from moving the right work across boundaries. A model optimization helps inference. Removing seeks changes the replay bottleneck. Moving inference offline changes how long the user's screen is occupied. Removing HTTP from the hot loop protects sample density. These are related improvements, but they are not interchangeable.
The same applies to data quality. Roster filtering reduces impossible identities. Calibration addresses systematic coordinate error. Temporal correction addresses short inconsistencies. Reconstruction supplies estimates where observations are missing. Keeping their origins visible is what makes the result useful to someone who wants to analyze it seriously.
I also had to carry that discipline into the product. An extractor can produce good files and still be awkward to use. Process progress, login, import recovery, event navigation, and annotations are the pieces that turn those files into something another person can work with.
Ward brings together the kinds of development I enjoy: a concrete product problem, a difficult data source, and enough frontend and backend work to make the result accessible. If you want to see the interface, try the public Ward demo. If you are building an application with similarly awkward integrations or data pipelines, you can contact me about a freelance mission.
ROFL extraction FAQ
Can Ward convert a ROFL file directly into JSON without League?
The extraction path described here needs League to play the replay on Windows. It reads local game state and detects positions from the rendered minimap. Once a capture bundle exists, offline analysis can run without replaying the ROFL.
Does ROFL extraction require a Riot API key?
This local extraction path does not require a public Riot developer key. It uses the local Live Client Data and Replay APIs. A Ward account key is a separate credential for reading your imported match data through Ward's public API.
Can it process an old League replay?
Only if a compatible client can play it. An already saved capture bundle avoids that replay dependency for subsequent analysis, because the images and associated snapshots have already been recorded.
Does 98% coverage mean 98% accurate positions?
No. In the recorded benchmark, coverage measures the presence of positions among captured player-frames. It includes reconstructed positions and excludes dropped frames from its denominator. Spatial accuracy requires independent reference positions.
Why not extract every replay at 32×?
The recorded sweep shows shorter screen time but more dropped grid points and worse visual coverage, especially in a busy mid-game window. The current automatic deferred path favors a 12× cap and can adapt toward 16× for long games.
Does the extractor recover every ward placement?
The implementation covered here extracts champion positions and the events and player state exposed to it. A player's ward score is not a ward-coordinate stream. I do not claim complete ward placement and expiry tracking from this pipeline.
Can I review a match on a Mac or in a browser?
The capture stage described here requires Windows and League. The web review stage works from the extracted data, so the browser does not need to run the replay client.
Technical references and measurement provenance
This article describes the implementation reviewed at Ward revision 73e51df and the public demo captured on September 21, 2026. The repository was private at the time of writing, so source paths below are an implementation map rather than public links that would lead to a permissions error.
apps/extractor/BENCHMARK_ONSCREEN_TIME.md: July 1, 2026 capture sweep, test environment, whole-game and windowed coverage, and source breakdowns.apps/extractor/CHANGELOG.mdandRELEASING.md: earlier experiments, model-runtime migration, packaging, and changes over time. Historical defaults are checked against code rather than repeated as current behavior.extractor/pipeline.py,bundle.py, andanalyze_bundle.py: scheduling, background reads, capture, ordered writing, and offline analysis.extractor/detect.py,onnx_backend.py,geometry.py,correct.py, andreconstruct.py: model integration, input sizing, calibration, correction, and inference provenance.apps/api/app/services/match_ingest_service.ts,clickhouse_schema.ts, andmatch_query_service.ts: streaming import, storage schema, lifecycle, and queries.apps/desktop/src/main/extractor.ts,apps/web/app/composables/useReplay.ts, anddocs/public-match-api.md: current desktop defaults, browser playback, and account-key API boundaries.- Riot Games: game client interfaces, ONNX Runtime: DirectML, the detector model card, and ClickHouse: partitioning guidance.
Nuxt Form Composable
Découvrez comment gérer facilement vos formulaires dans Nuxt grâce au module Nuxt Form. Soumissions, transformations et validation simplifiées
typescript.news: How I Built a Fully Autonomous AI Newsroom
A tech news site that researches, writes and publishes its articles on its own. Here is how I wired an OpenClaw agent, a self-hosted SearXNG instance and a few cron jobs into an autonomous newsroom built on Nuxt.